
DBD: Usage History Summary Report
The Usage History Summary Report prints monthly item usage and an aggregated yearly total for each catalog item. Because this analysis can be run over a multi-year timeline, it serves as a valuable tool for identifying seasonal consumption patterns and mapping out accurate suggested reorder metrics.
Key Features
- Catalog Type Grouping: Includes flexible execution parameters to isolate only custom items, restrict to stock items, or display both item categories simultaneously.
- Corporate Hierarchy Rollups: Features the ability to combine item usage records across multiple distinct customer accounts that belong to the same parent Customer Group.
- Multi-Year Timelines: Compares monthly run rates side-by-side across trailing fiscal years to identify long-term trends versus temporary anomalies.
Navigate to: DB Distributor > Print Management > Reports > Items > Usage History Summary
Available Sequences
When generating the report, the data is organized using the following sequence option:
- By Customer / Item
Understanding the Report Output
The output maps volume velocities over individual calendar blocks, and displays quantities scaled to higher denominators (e.g., Usage reported in 1,000s) for simplified reading:
| Column / Section | Description |
| Item / Description | The unique catalog item identifier code and its system description string. |
| Monthly Avg Usage | A calculated benchmark showcasing the regular monthly velocity baseline for the product. |
| Unit / Qty | Identifies the default packaging or release unit designations. |
| Locn | The specific warehouse or customer location profile tied to the usage tracking line. |
| Year | Segregates historical data into separate horizontal comparative rows per calendar year. |
| Usage by Month Grid (JAN - DEC) | Breaks out precise consumption quantities recorded during each specific calendar period. |
| Total | The sum total of all units distributed across that specific year's row. |
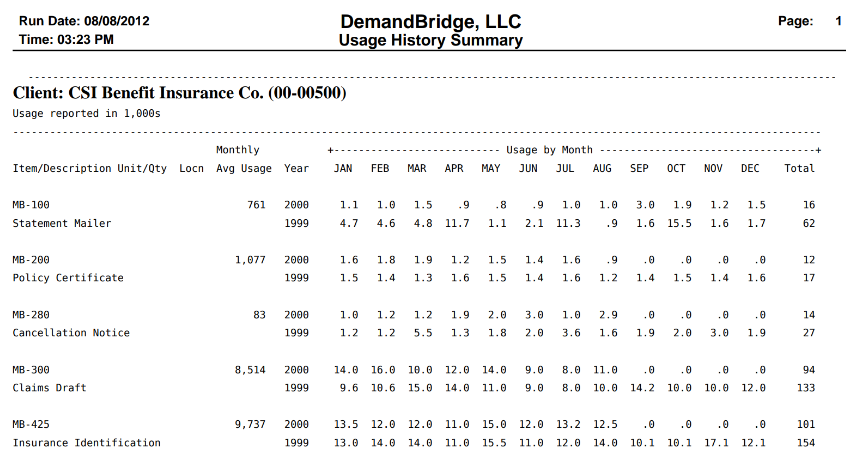
💡 Tip: When evaluating your output, review the measurement scale noted in the header block (such as
Usage reported in 1,000s). This ensures you accurately translate shorter figures (like15.5) to their true volume equivalents (15,500) when determining seasonal inventory replenishment.