
DBD: Print Management Status Report
The Print Management Status Report is a comprehensive, general-purpose customer report designed to balance historical usage analytics with current, cross-location stock availability. It translates total combined quantities into a rolling day-supply forecast, allowing distributors and clients to instantly pinpoint which inventory items are dropping near critical reorder thresholds.
Key Features
- All-in-One Data View: Combines trailing velocity metrics with actionable warehouse distribution figures side-by-side on a single line entry.
- Cross-Site Stock Visibility: Displays physical quantities sitting in primary distributor fulfillment warehouses alongside counts from monitored customer locations.
- Proactive Procurement Forecasting: Automatically converts total on-hand volume into a calculated days-of-supply metric, which highlights stock depletion paths when compared against the item's minimum day requirement.
Navigate to: DB Distributor > Print Management > Reports > Customers > Print Management Status
Available Sequences
When generating the report, the information can be sorted using the following sequence options:
- By Customer / Item
- By Location
- By Customer Group
Understanding the Report Output
The output table is divided into two operational halves—Usage Information on the left and Item Availability on the right:
| Section / Column | Description |
| Item Code & Description | Displays the unique catalog product code and label text, with manufacturer or tracking numbers listed below. |
| Primary U/Issue | The standard stocking or fulfillment Unit of Measure (e.g., CASE ) followed by the quantity packed per unit. |
| Current Period (Usage) | Actual quantity distributed or shipped out within the current active cycle. |
| Year to Date (Usage) | Cumulative consumption volume tracked over the fiscal year to date. |
| Usage / Month (Usage) | The calculated historical average monthly run-rate velocity for the item. |
| In Warehouse (Availability) | The physical inventory count currently resting inside primary distributor storage. |
| Customer Site (Availability) | Inventory volumes counted and tracked directly at designated client locations. |
| Days Sup O/H (Availability) | Projected time to depletion (in days) calculated by dividing total stock by the average daily usage. |
| Sup Min (Availability) | The defined baseline threshold safety-stock limit configured for the item profile (in days). |
| Qty on Order (Availability) | Quantities currently placed on open manufacturing or replenishment purchase orders. |
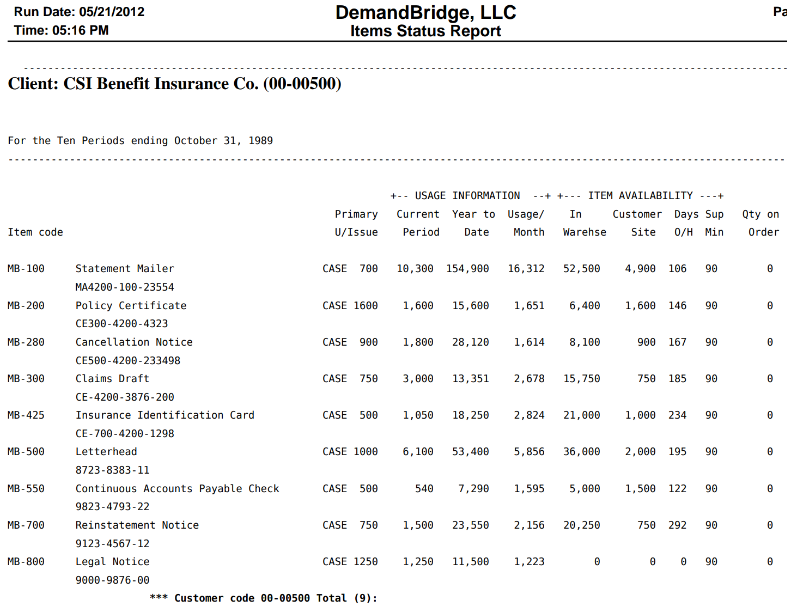
💡 Tip: Keep a close eye on any row where the Days Sup O/H falls below the Sup Min figure. These are your critical red flags indicating that a reorder should be initiated immediately to prevent a stockout.